Script Recording

To access Script Recording, select Script from the top panel. In Script, select the recording icon as shown in the following figure.

Figure 120: Script Recorder

The script can be recorded using LoadTest Browser. Recorder scripts can be saved in either C language or Java language. Users can also record RBU scripts via WebClickAndScript. Fill in all the details and click on record.

  • Project/Subproject: Path (project/sub-project) where the recorded script is stored.
  • Name: The user can either enter a new script name or use the old script as well for recording a new flow in the same script.
  • Flow Name: Name of the flow.
  • Type: Select any of the following types as per the requirement:
    • WebC(HTTP/HTML)
    • WebJava(HTTP/HTML)
    • WebClickAndScript
    • WebClickAndScript(Java)
  • Browser Type: Select as per the requirement LoadTest Browser/External Browser or Native Browser.
  • Recording Profile: By default, the default recording profile is selected. By clicking the ‘Show’ button, the user can view or modify the profile settings. Once all changes are made, the user can choose to save the changes to the current profile or create a new one using the Save As button. These settings will be used during the script recording process.
  • Enter the URL: Enter the URL (e.g.: https://www.example.com/).


Recording Profile Details (Default)

Browser options 

Figure 121: Browser Options

It has the following types:

  • Clear cache:The cache will be cleared before creating browser for recording.
  • Clear cookie:The cookie will be cleared before creating browser for recording.
  • Clear Local Storage: The Local Storage will be cleared before creating browser for recording.

Note: The Incognito mode will be activated once these three options have been selected.

Split Page Options

 This option customized how URLs are treated in the recorded script. Use criteria like time duration or HTTP methods (POST, PUT, HEAD, etc.,) to split the pages and designate the main URL.

Figure 122: Split Page Options

While recording a script the page can be split using the below options:

  • Time: If the time difference between two URLs exceeds the specified duration, the subsequent URL will be considered the main URL.
  • Method: Inline Url will be categorized as Main URL for selected Methods like POST, PUT, HEAD, DELETE.
  • Request Header Contains: If request contain XmlHttpRequest header then it will treat the request as the main url.
  • User Action: If any user click occurs it will have spilt the page and treat the clicked url as main url.
  • Content type of Response Header: If content type of response header is application/JSON it will split the page.

LoadTest Browsing Options

Figure 123: LoadTest Browsing Options
  • Javascript – It will enable the javascript option so that at the time of recording it will record all the inline JS calls.
  • Image Download – At the time of recording if a user downloads any image then it will also download that image in the script and save it in a directory so that the user can use that image at the time of executing the script.
  • Disable Plugins – Chromium plugins can be disabled using this option while recording ensuring a streamlined browsing experience.
  • Ignore Security Certificate Warnings – Option is used to bypass security certificate warnings during recording allowing access to websites with SSL/TLS certificate issues.
  • Escape Authentication – Skip authentication pop-ups during recording providing uninterrupted browsing. It is also to be noted that this may result in unauthorized access.
  • Snapshot Capturing – Capture a screenshot of the page after successfully reloading a new URL-enhancing script visualization.
  • PreSnapshot Capturing –Capture a snapshot of the previous page visited before loading subsequent URLs aiding in script analysis.
  • Verify SSL Certificate– Verifies the authenticity and validity of the SSL certificate used by a website. This verification ensures that the website’s connection is secure.
  • User Agent String –Users can choose the User agent from the drop down that will be user in the browser. The Default User agent is “Mozilla/5.0 (Windows NT 10.0; Win64; x64) AppleWebKit/537.36 (KHTML, like Gecko) Chrome/107.0.0.0 Safari/537.36”.
  • Open Browser in Hardware Accelerated Mode: When the option is enabled, Browser renders content using GPU and displays it directly on a surface However, when the option is disabled, Browser renders the content using GPU and copies the pixels to RAM
  • If rendering performance is very important for the application, then it is recommended that you use the default Hardware Accelerated mode.

Configure proxy server for recording

In this section, the user can configure a proxy server for recording. A proxy server is a server that acts as an intermediary for requests from clients seeking resources from other servers. A client connects to the proxy server, requesting some service, such as a file, connection, web page, or another resource available from a different server and the proxy server evaluates the request as a way to simplify and control its complexity.

Figure 124: Configure proxy server for recording

No proxy: By selecting this option, no proxy is applied to access the web server. This is the default option.

Use system proxy settings: If the user selects this option, the proxy settings which are set for the system are applied. In case of system proxy is already defined, those settings are loaded for any view/updation. Else, it appears as in the case of manual proxy configuration. Users can configure system proxy settings and save them. System proxy setting would be configurable only from default scenario settings when the user login as Admin.

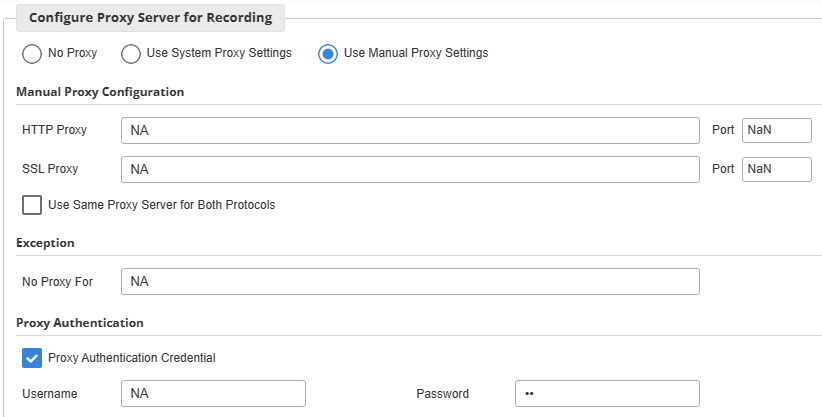
Use manual proxy settings: In manual proxy settings, set up the proxy manually.

The Manual proxy section contains the following options:

  • Manual proxy configurations
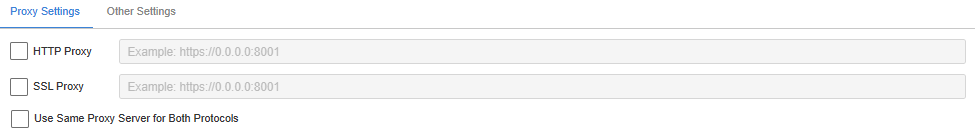
  • HTTP Proxy: An HTTP proxy is a category of network settings that can be configured in the network (or Internet) accessing applications. Specify the HTTP proxy in the following format: http://ip:port. Port number ranges from 1 to 65535. By default, it is 80.


  • SSL Proxy: It routes traffic from a client to a web server using the Secure Sockets Layer (SSL) protocol. SSL is an encrypted protocol that creates a secure connection from a client to another client or server. Specify the SSL proxy in the following format: https://ip:port

Port number ranges from 1 to 65535. By default, it is 443.

To have same proxy server for both HTTP and HTTPs protocols, select the Use same proxy server for both protocols check box. All protocols are using same server and port for all the protocols.

  • Exceptions: Exceptions options get enabled in case the Manual proxy configuration check box is selected. To bypass the proxy server for the local address, specify the local address for example, 168.1.0/24 in the No Proxy for text box then select the Bypass proxy server for the local address check box.
  • Proxy authentication credential: The user’s credentials are verified here. If the user selects the Proxy authentication credential check box, the following options are displayed. Enter the User Name, Password, and Confirm Password.

Password and Confirm password values are encrypted and are verified at the back end.
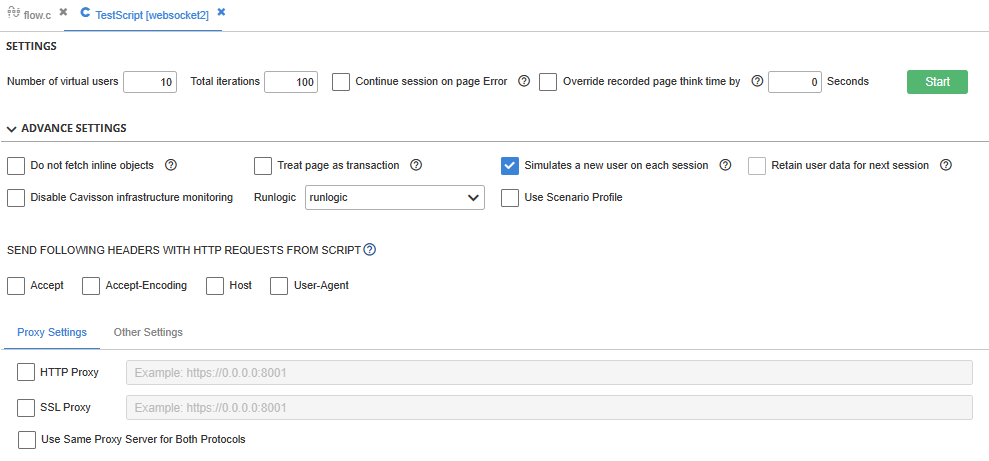
 

Advanced

Header Setting

The purpose of the header setting section is to manually specify the header name and its value. Users can add more than one header in the script by clicking the More button. They can also replace or append the header. In the case of Replace, the header specified replaces the existing header. In case of Append, the specified header is appended to the existing header.

Cookie Setting

The purpose of the cookie setting section is to manually specify the cookie name and its value. Users can add more than one cookie to the script by clicking the More Cookie button.

In some cases, if the user wants to record headers, such as Referer, User agent String in the flow file of script so that LoadTest can send only those headers which are present in the flow file of the script. In this case, the user needs to record all headers in flow file of the script. For this, Advanced tab for Header recording is implemented in Script Manager GUI.

Script Settings

Body Size Option: If the size of the body content exceeds the given size in the textbox, then the body content will be saved in the newly created file which will be linked to the flow (http_request_body) in the script directory.

Advanced

While recording, some browser default headers are not recorded. which are Accept, accept–Encoding, Keep Alive, User–agent, Host, Connection, and referrer. because these headers are added by the browser while sending a request to the server.

If the user selects the All check box, All Headers checkboxes are enabled and displayed in the flow file of the recorded script. Users select any of the header checkboxes provided.

Add Transaction in recorded script

You can specify the settings for adding a transaction in the recorded script by selecting one of the following options:

  • Automatic:Add the start and end transactions automatically to all the pages of the recorded script in the flow file for simplifying performance measurement.
  • Manual: Add the start and end transactions manually in the browser during the recording. It helps in providing flexibility for precise transaction control. Each entered transaction has a Status column indicating the state of the transaction. The following Transaction Status is supported:
    • Started: It means the transaction has been started.
    • Ended: It means the transaction has been ended.
    • Autoend: It means the transaction automatically ends after the next page.

Exclude URL Filter: To exclude any URL from the recorded script, give the URL pattern. During the recording, any URL that matches the specified pattern will not be included in the recorded script.

Figure 125: Recording Page 1- Login Details
  1. Click the “flights” button to find flights.

(Recording Page-2)

Figure 126: Recording Page 2 – Find Flights

2. Enter the flight details: (Recording Page-3)

  • Select the Departure City as “New York” and Departure Date is default.
  • Select the Arrival City “Paris” and Return Date is the default.
  • Enter No. of Passengers as 2.
  • Select Seating Preference as “Window”.
  • Select Type of Seat “Coach”.

3. Click the continue

Figure 127: Recording Page 3- Flight Details

4. Select the third option for Flight. Click the continue button. (Recording Page-4)

Figure 128: Recording Page 4 – Flight Selection

5. Enter some dummy personal details – Name Address and credit card details. Click the purchase flight button. (Recording Page-5)

Figure 129: Recording Page 5- Payment Details

6. This is flight confirmation page to confirm the flight. Click the sign-off button on the left side to log out. (Recording Page-6).

Figure 130: Recording Page 6- Flight Confirmation

7. This is the logout page that confirms that the user has successfully logged out. (Recording Page – 7).

Figure 131: Recording Page 7- Logout Page

8. To finish the recording, click the Stop Recording button on the script management window. The Script is created.

9. After the creation of the script, recorded script page names are displayed.

Figure 132: Recorded Script Page
  • Above are the default page names that come automatically from Query String, selecting only the last part of the URL.
  • If two pages have the same name then it is differentiated by pagename_2 for the second page, pagename_3 for third page and so on.

            Example:

  • findflight
  • findflight_2
  • findflight_3, of recorded script


User can change the page names by clicking the Change button.

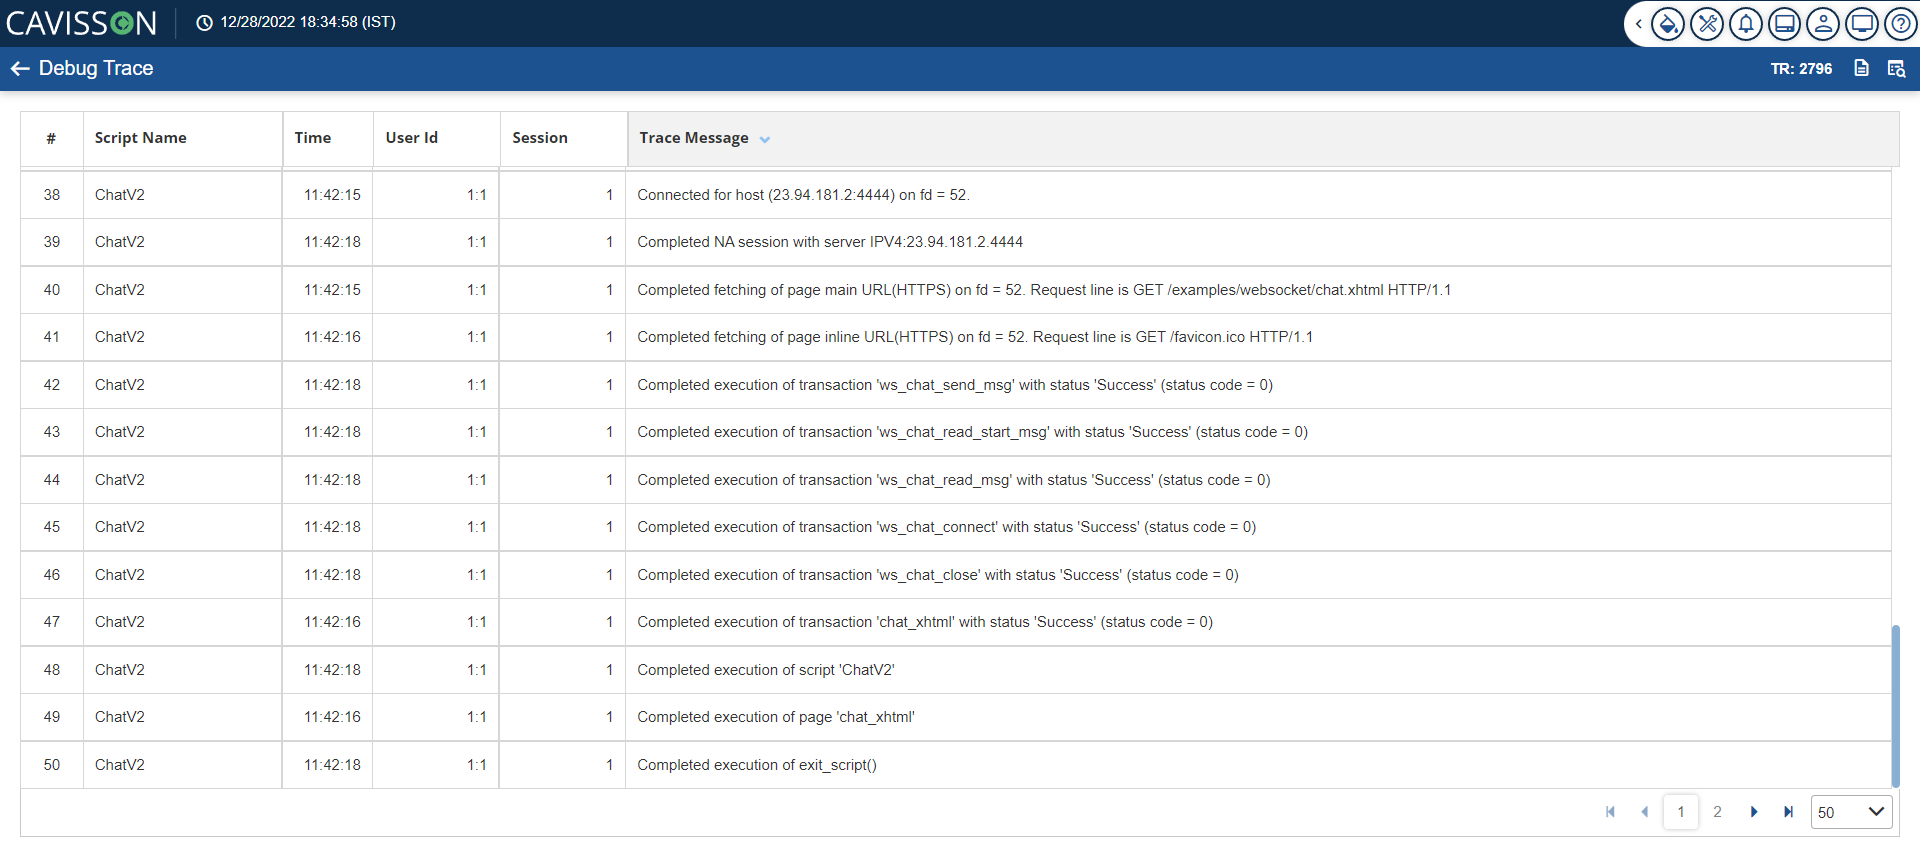
Debugging Tools Support in LoadTest Browser

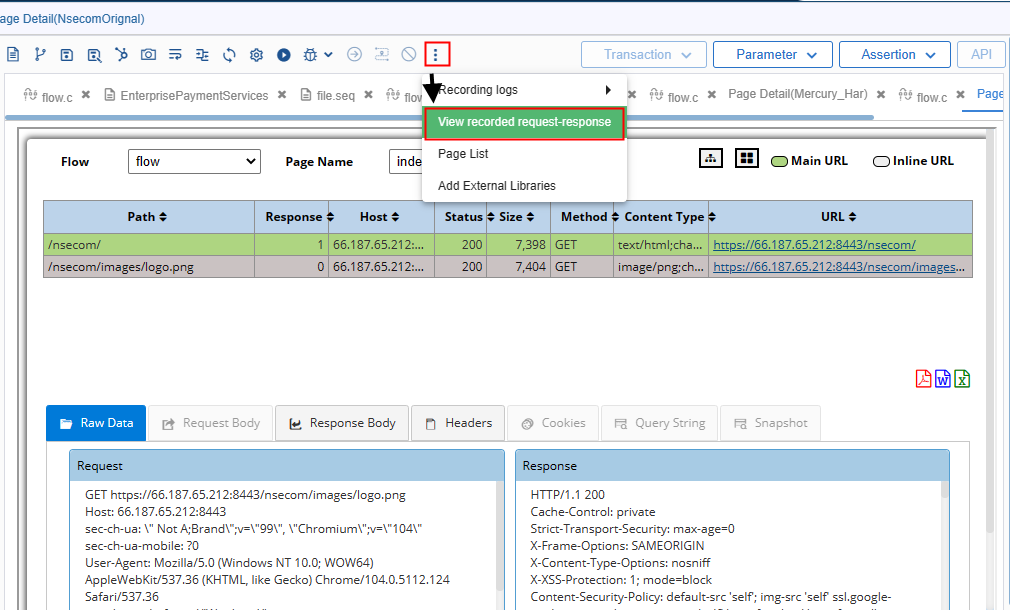
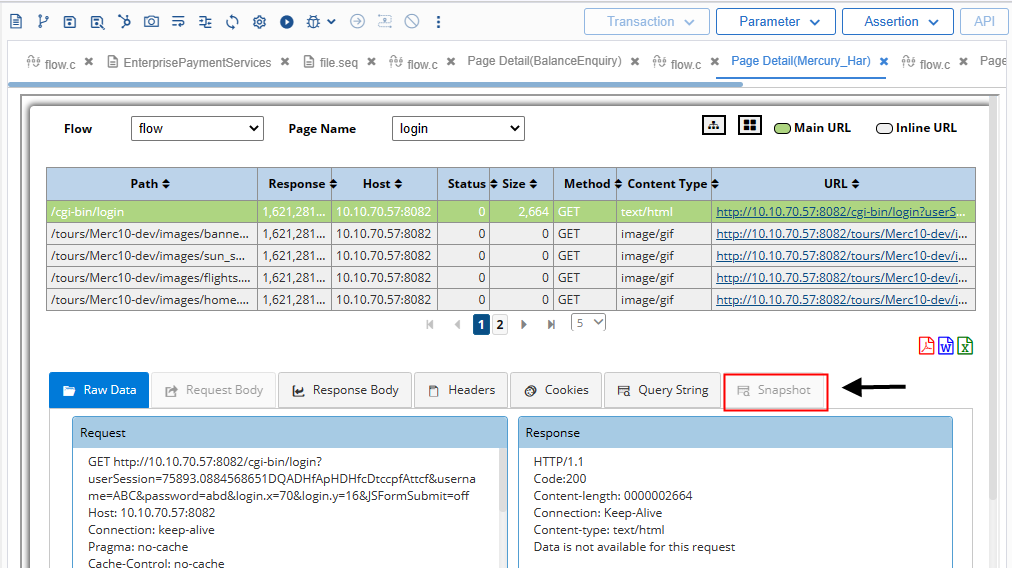
Debugging tools support enables a user to view the request/response in script recording using LoadTest browser.
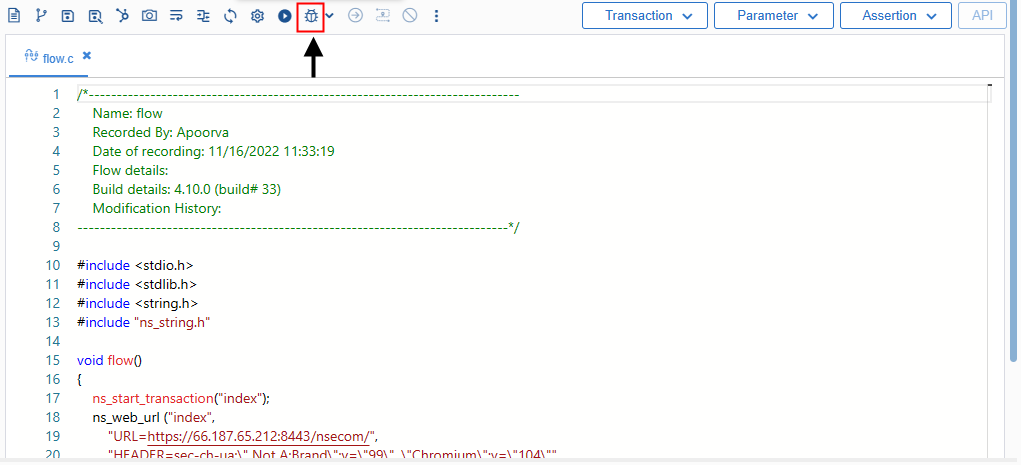
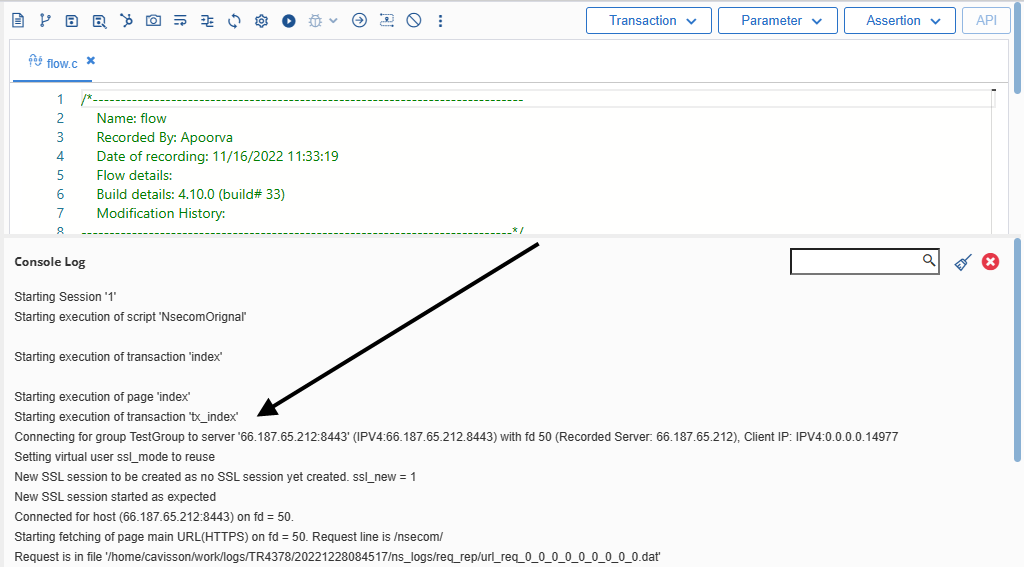
Figure 133: Debugging Icon

Debugging mode

When a user clicks the  icon, debug mode is ON. User can see the request/response over the network.

Adding Multiple Transactions while Recording a Script

To add a new transaction during the recording process:

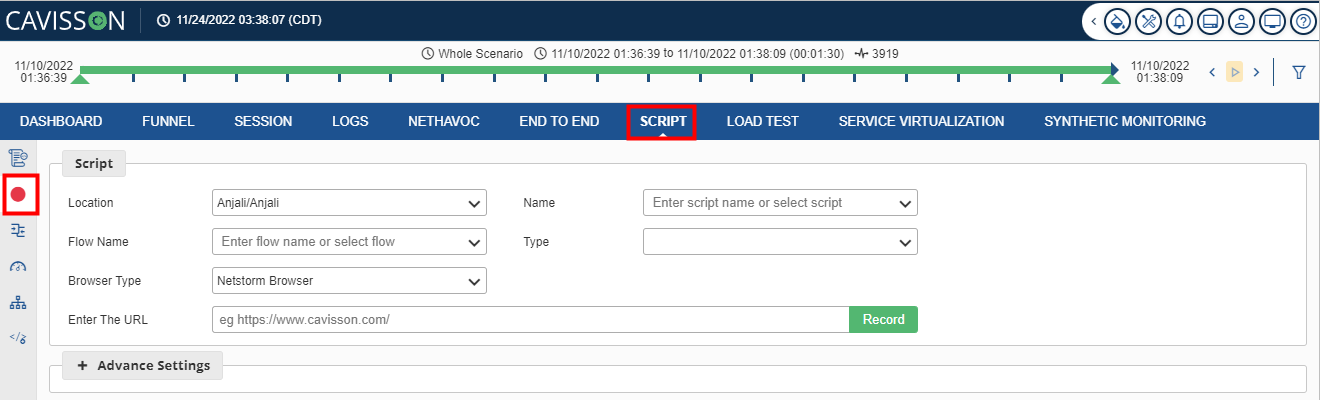
  1. Click the Start Recording button, the Script Recorder dialog box is displayed.
  2. Click the Advanced Settings button.
  3. Select the Custom option in the Advanced
  4. Click OK and start recording.
  5. Click the Add Transaction button in the browser to open the transaction window.
  6. Specify the transaction name and click Add button to add the transaction, as shown in the following figure:
Figure 134: Adding Transaction

Renaming/Ending/Removing a Transaction

To rename a transaction:

  1. Select the transaction you want to rename and click the Rename
Figure 135: Renaming Transaction

2. Specify the name corresponding to the selected transaction.

3. Press Enter.

Similarly, to remove/end a transaction, select the required transaction and click the Remove/End button, respectively.

Enable/Disable Auto End Transaction

If you want to add the transaction as Auto End, select the option Enable Auto End Transaction. By default, this option is enabled.

Figure 136: Enable Auto End Transaction Box

Viewing Snapshot of Recorded Script

  1. To view the snapshot of the recorded script, click the View recorded request response from the kebab menu on the toolbar.
Figure 137: View recorded request response

2. Now select the snapshot option as shown in below figure.

Figure 138: Script Page Snapshot

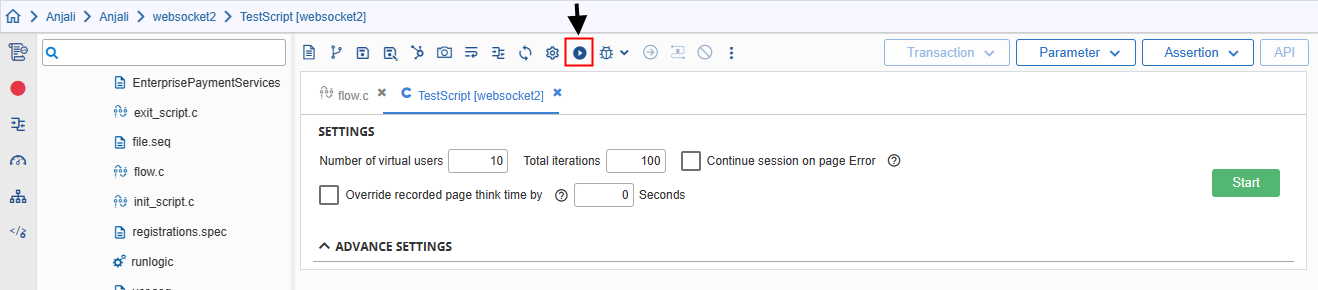
Testing the Recorded Script

Script Testing is useful for quick testing of recorded scripts. By Script Testing, the user can easily look at the flow and how the script is recorded. It should be noted that Script testing is not meant for those scripts which are taking dynamic values. For example – Account number, Username, Password, etc.

  1. To test the recorded script, click the Test Script button on the Script Manager window.
Figure 139:Test Script Button

2. The Test Script dialog box is displayed in Figure 134.

Figure 140: Test Script Dialog Box

3. First, the user needs to specify the number of virtual users and number of iterations. Further, there are certain features for users, such as

  • Fetch/do not fetch inline objects.
  • Treat page as transaction or not.
  • Simulate a new user on each iteration.
  • Retain User Data for Next Session.
  • Send following headers with http requests from script.
  • Disable Cavisson Infrastructure monitoring
  • Override recorded page think time by specified seconds.
  • Scenario profile: The user can use the existing scenario profile while executing a test from script management.
  • Runlogic

4. On clicking the Advance Settings button, the user is navigated to a dialog box to set the proxy settings and Java settings.

Proxy Settings: Here, the user can specify the protocols, such as HTTP proxy/port and SSL proxy/port. Users can also set the same proxy server for both protocols. For example: proxy.cavisson.com.

Figure 141: Proxy Settings

Others: Here, the user can set the HTTP No Activity Timeout and response timeout if it is enabled.

Figure 142: Others

5. Specify the details and click the OK Next, the user is navigated to the Test Script dialog box, and click OK. The script testing is processed and generates a list with time stamps and trace messages.

Figure 143: Script Test Completed Page

Scripts Debugger

The Script debugging feature allows a user to debug the script by adding a breakpoint so that the user can analyze or verify the data or flow by printing the value of any variable/step execution to verify the condition.

  1. User can add Breakpoint by clicking on the line number in flow file of the script.
Figure 144: Breakpoint(mark in red)

Note: Breakpoints can be applied on C-type script and CLICK_AND_TYPE script.

2. For running script in Debug mode, there is an option “Debug script with 1 iteration”.

Figure 145: Run in Debug Mode

3. Start the test in debug mode.

4. Following options are enabled once the test is started in Debug Mode:

Figure 146: Start Test Debug Mode Icon
  1. Continue: Continue command starts the script replay and pauses it on the next breakpoint of the script.
  2. Step by Step: The ‘Run Step by Step’ command runs the script one line at a time. This enables the user to follow the script execution. The ‘Run Step by Step’ command starts the script replay and then pauses it on the first line of the script.
  • Stop: To stop Debug Test.

Note: If a user applies multiple breakpoints in a script and stops the debug trace by clicking the ‘Stop Debug Test’ button before execution of all the breakpoints, then test is stopped immediately and further breakpoints are not executed. The same is reflected in debug trace logs.

Details of Execution while executing Script having Breakpoints.

Figure 147: Executing Script Having Breakpoints

5. Debug Trace window for Request/Response & Test Run output details:

Figure 148 : Debug Trace Window